Three income streams. Two honest numbers.
Options premium, dividends, and price gains, each tracked across its full lifecycle and measured the way it pays you. Your options earn ROCAR, the return on the capital each trade put at risk. Your dividends and price gains resolve into one time-weighted total return, benchmarked against the S&P 500. The two numbers sit side by side and one never gets summed into the other, because a covered call and a dividend grower answer different questions. Your broker rounds all of this down to “premium collected.”
Premium collected is a vanity metric.
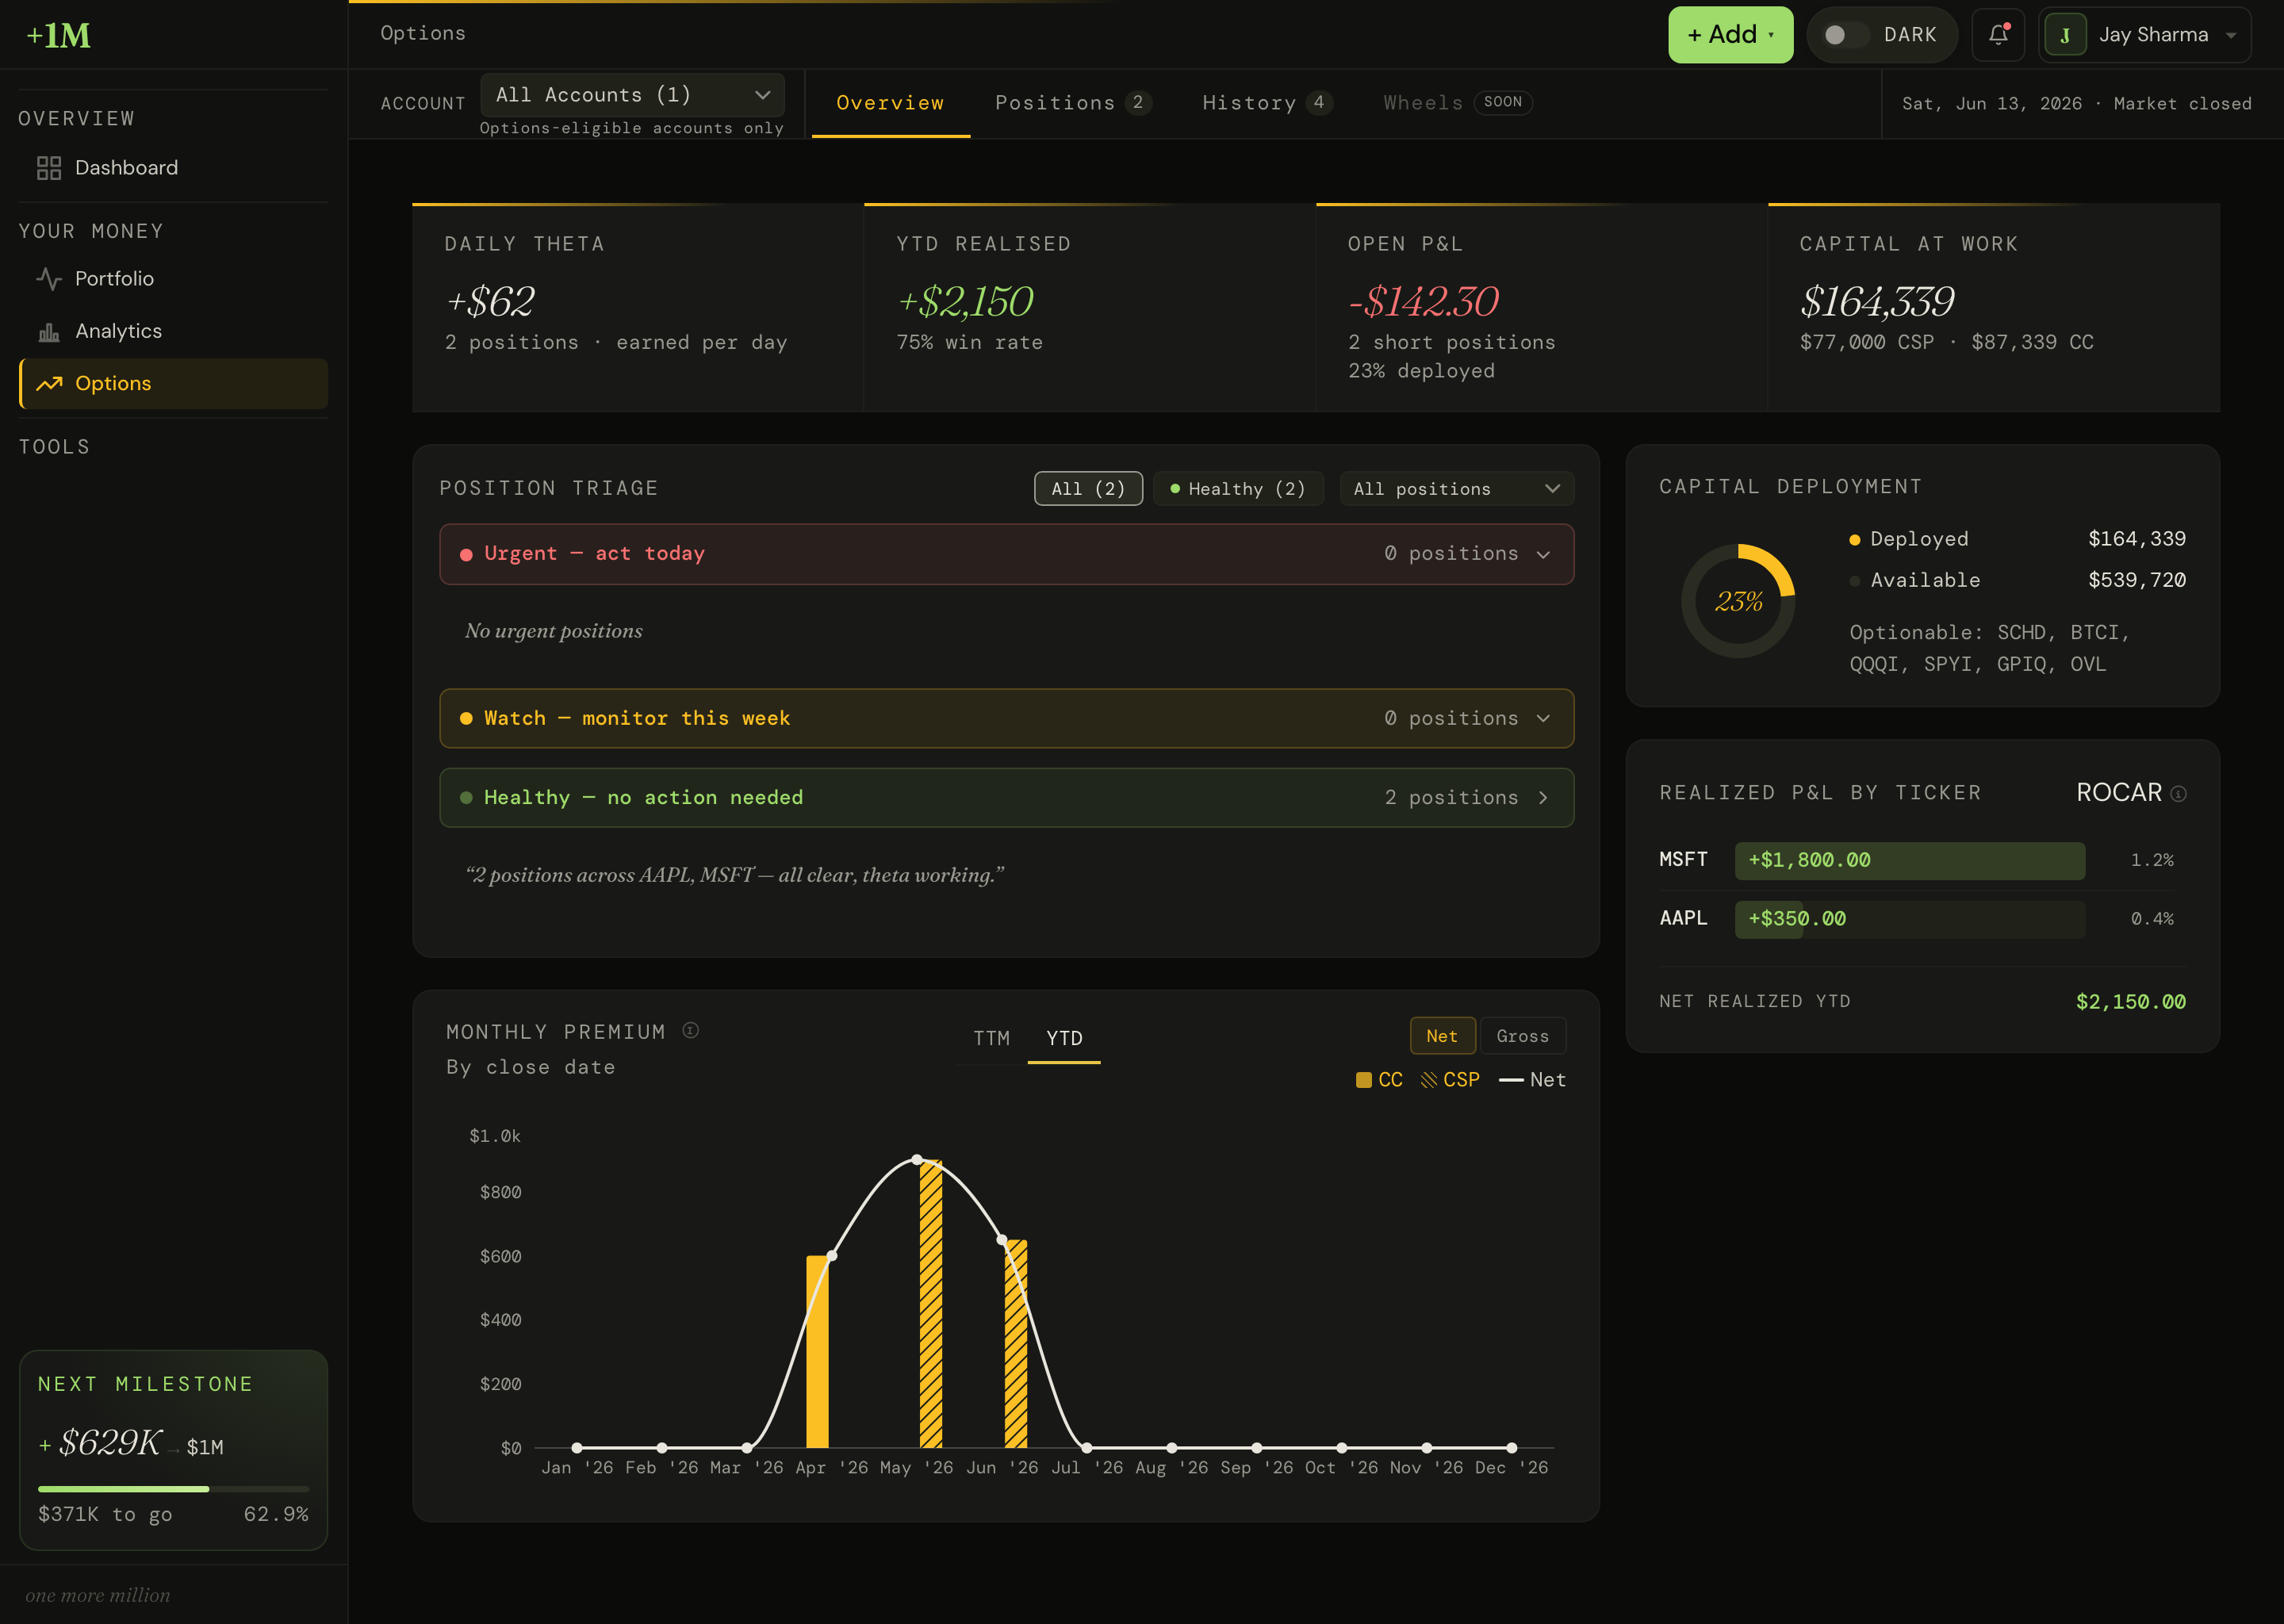
Covered calls, cash-secured puts, and the full wheel, tracked from open to close through every roll, expiry, and assignment. Your broker stops at premium collected. OMM computes ROCAR on your options: what they earned against the capital they tied up, net of fees. If your target is 2% a month on the capital at risk, ROCAR tells you whether last month cleared it or fell short.
- Full lifecycle: open, roll, expire, assign, close. Cost basis adjusts at every step.
- Position Triage: your book auto-sorted Urgent, Watch, Healthy. You check the five positions that need you and leave the other thirty-five alone.
- Roll Scout: surfaces the contracts worth rolling before expiry forces the call, with the math pre-computed.Solo
- ROCAR by strategy and by ticker: the trade’s return divided by the capital it actually tied up, so gross premium goes back to being an input.
- Real P&L, net of fees: every commission and contract fee already subtracted.
Dividends + premium, in one ledger.
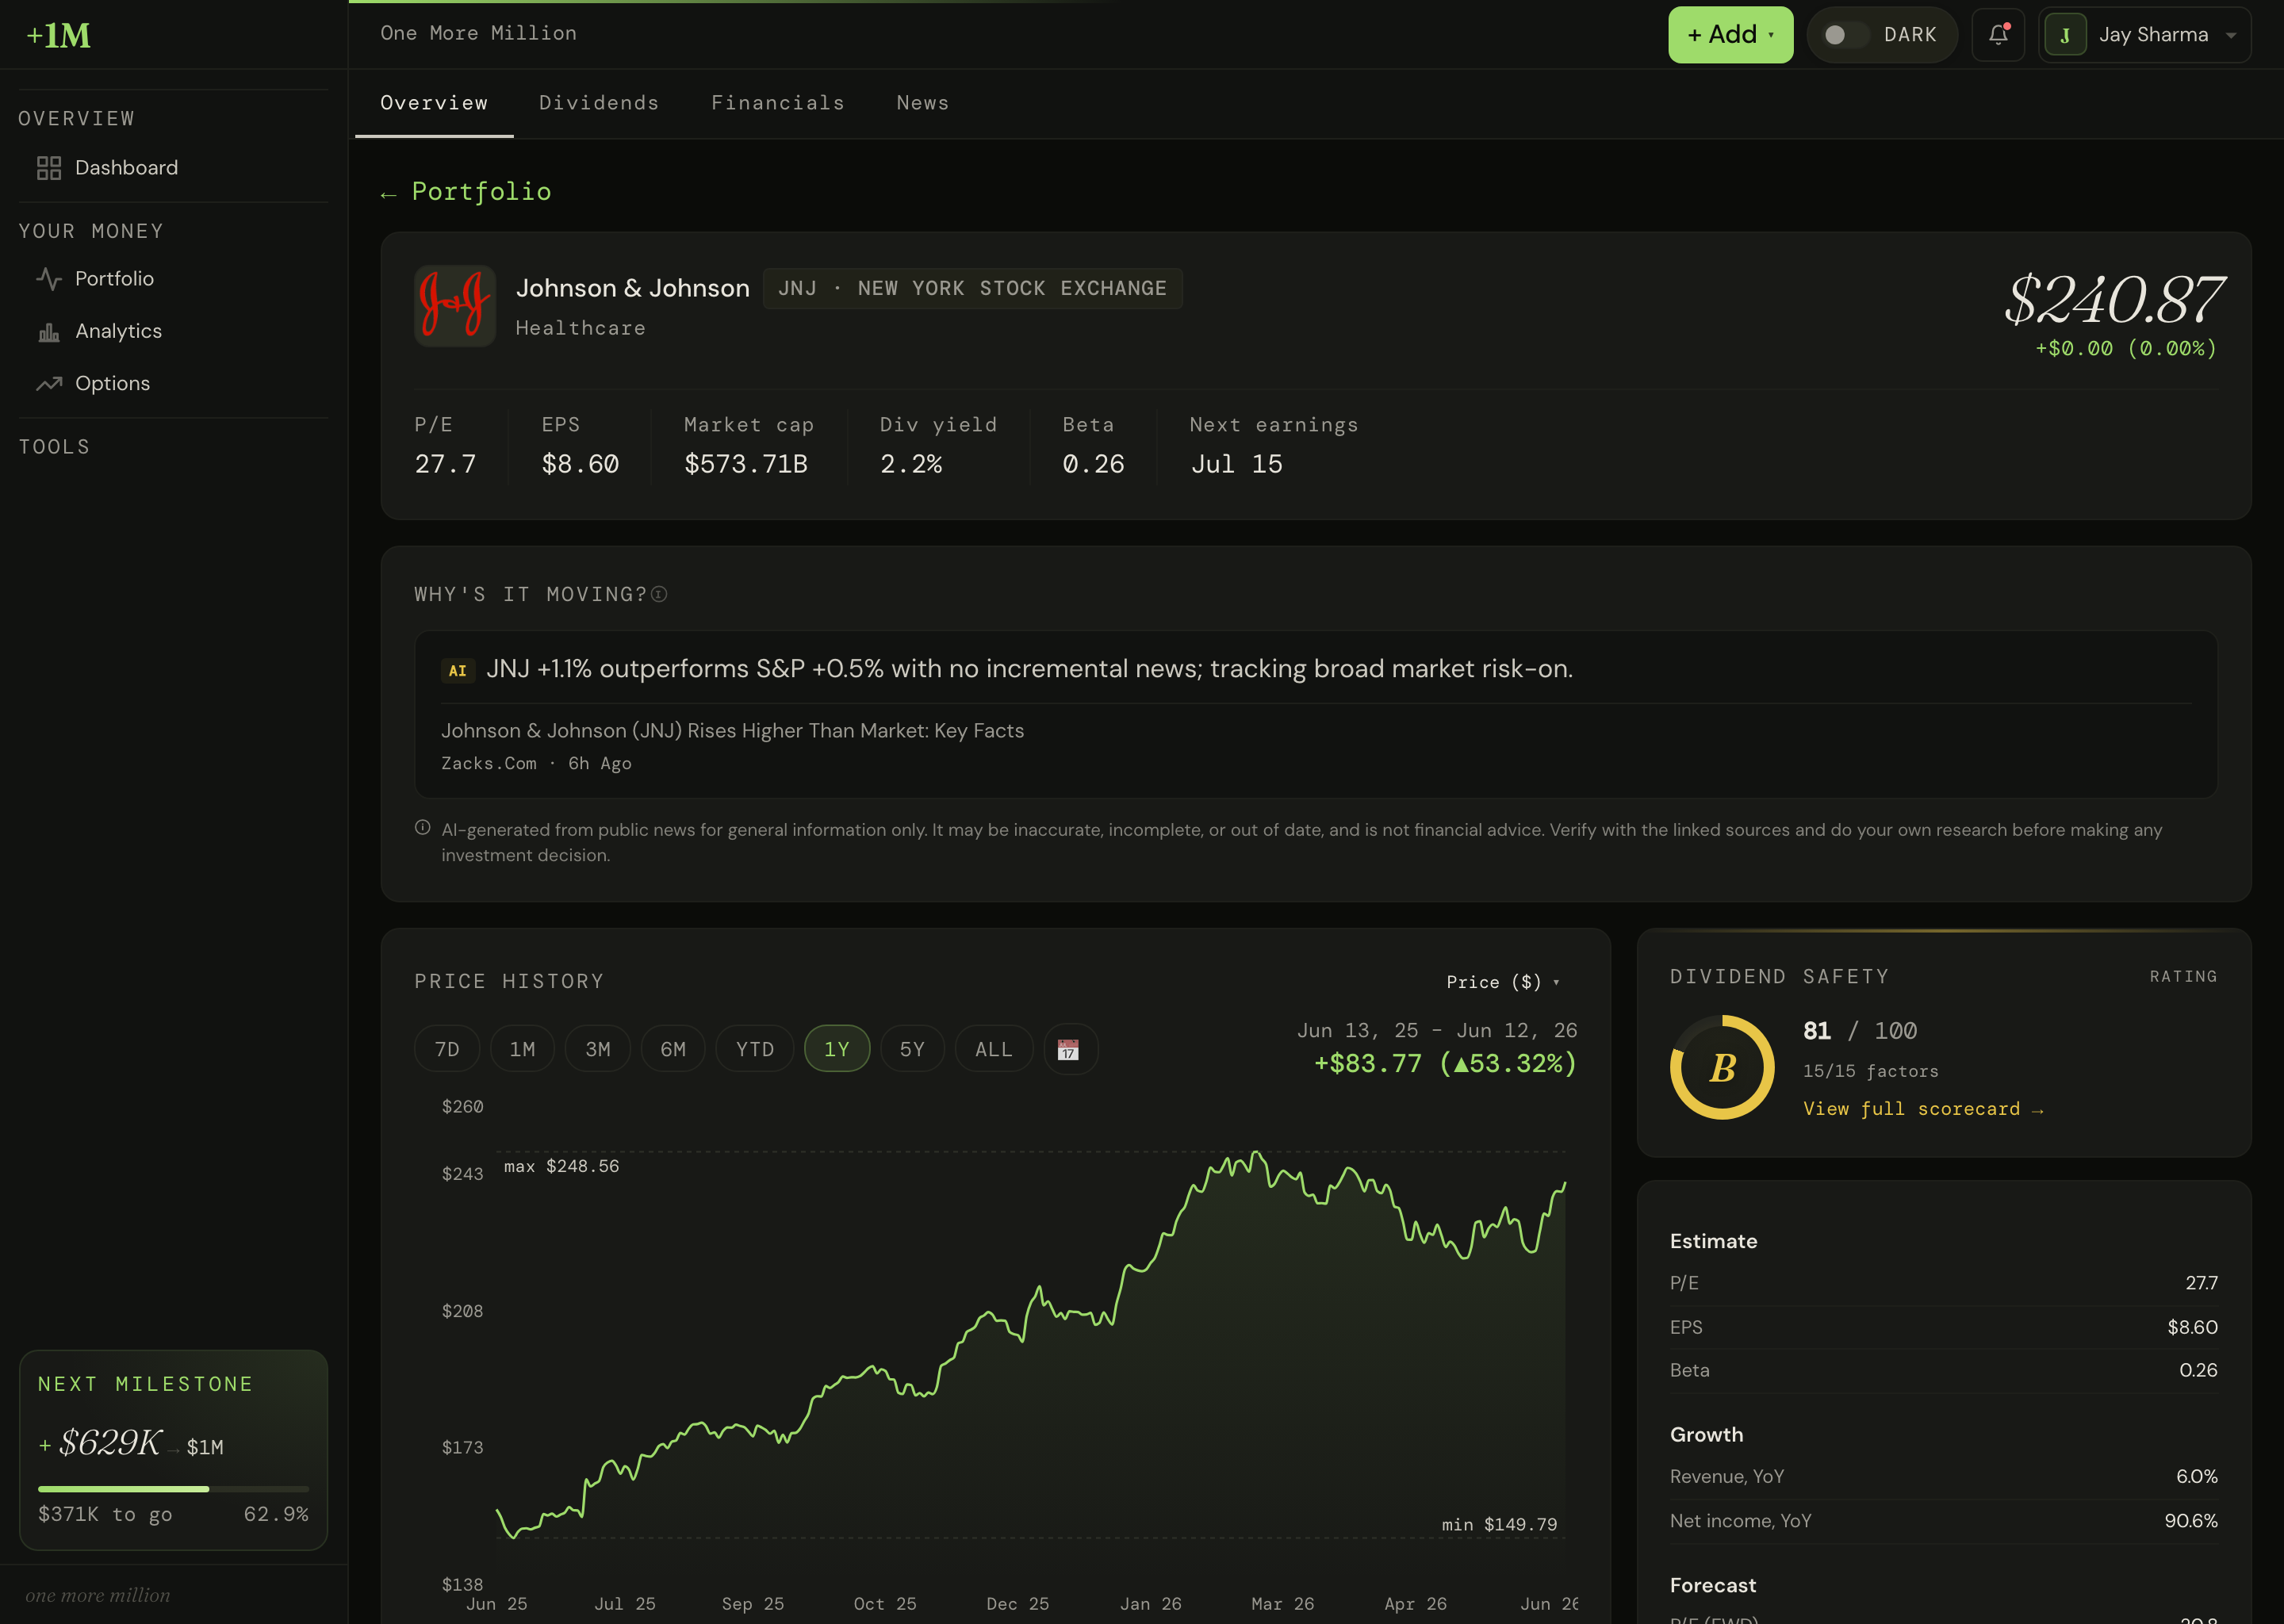
Track every payment, map the year ahead by ex-date, and read a safety rating on each holding: a 0 to 100 score with a letter grade, built from payout ratio, coverage, and dividend growth history. A stretched payout scores low while you can still act on it, before it ever lands lighter in your account.
- Safety rating per holding: 0 to 100 with a letter grade, from payout ratio, coverage, and growth streak.Solo
- Yield on cost: what your shares pay on the money you actually put in, shown beside today’s headline yield.
- Ex-date calendar and forward income: every upcoming payment, projected a year out.
- Income by account and combined: monthly and annual, per account or whole book.
- Dividends beside options premium: both income streams in one ledger, so you can close the second app for good.
The number your broker gets wrong.
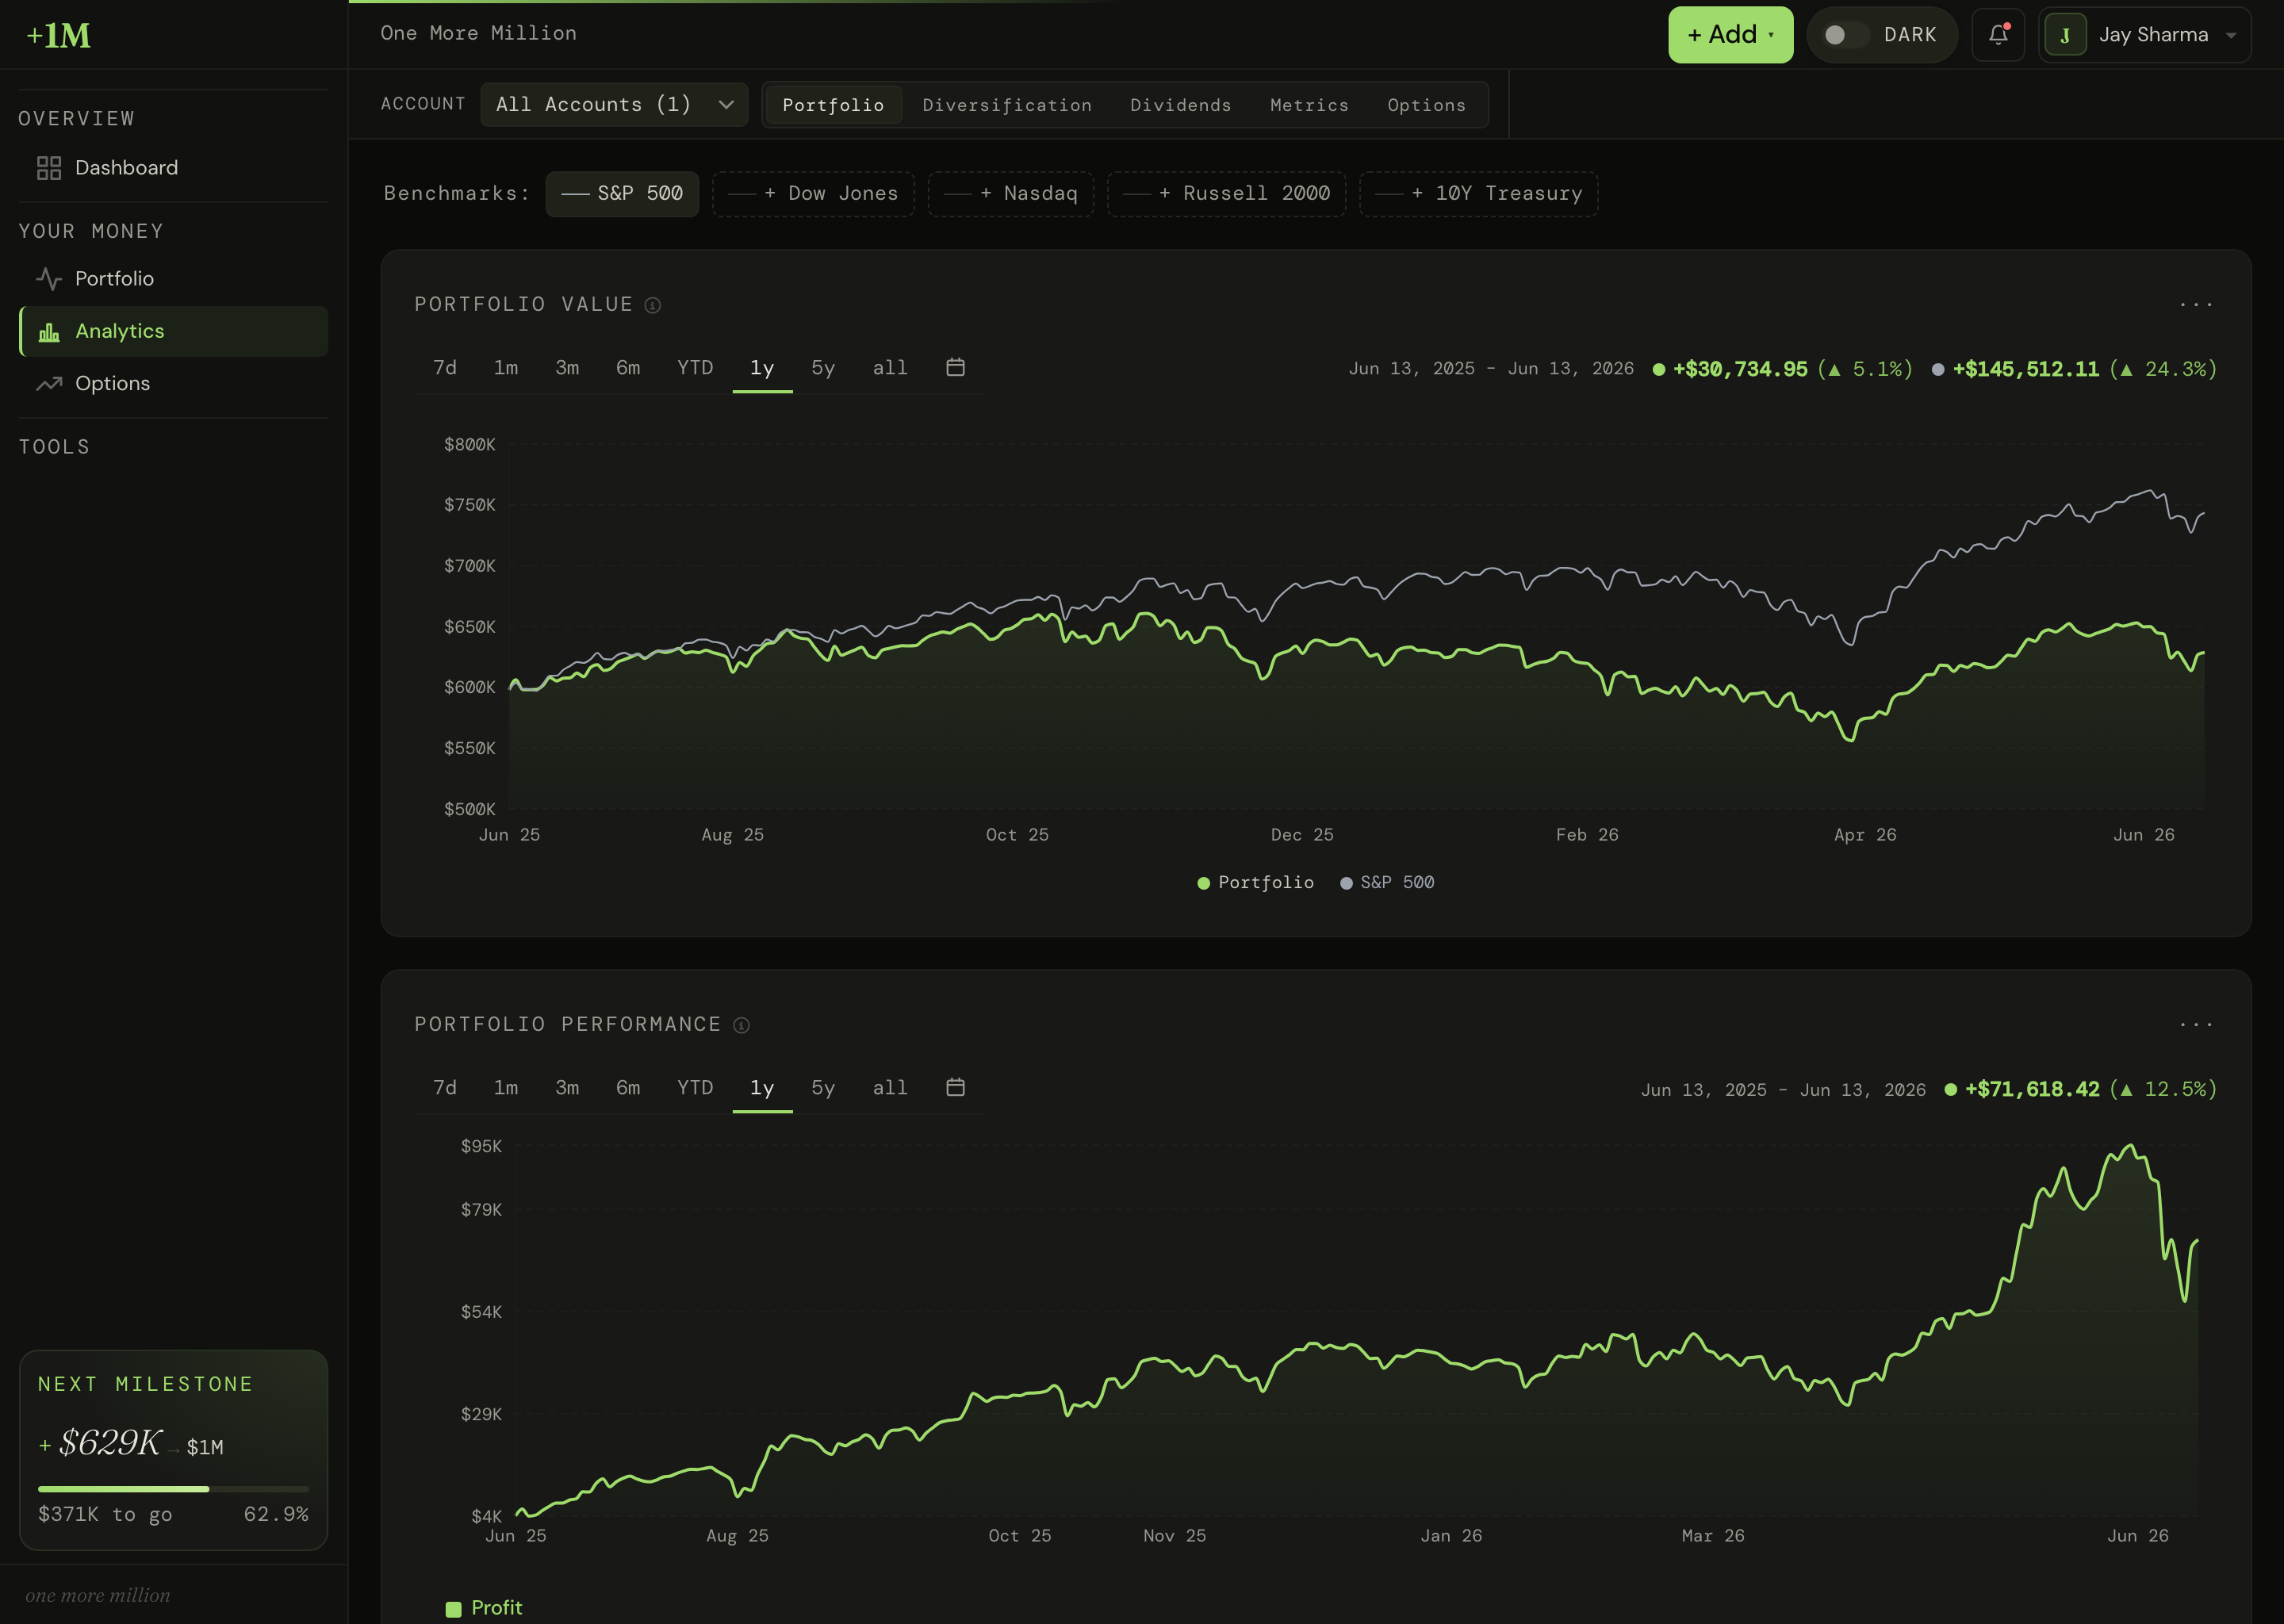
OMM aggregates every account into one view and puts two numbers on it. Your equities earn a true time-weighted total return, dividends and price gains folded in, charted against the S&P 500. Your options earn ROCAR beside it. The two never get added into one figure, because premium on capital at risk and growth on invested capital measure different things. TWR shows how your decisions performed. XIRR shows what your money actually made. Both run on your real cost basis, every fee included.
- Every account in one view, with per-account P&L. Nothing stays siloed.
- TWR and XIRR: time-weighted to judge your decisions, money-weighted to count your actual dollars.
- Benchmarked to the S&P 500 on the same chart.
- Total return counts dividends and price gains together, time-weighted. Options income stays beside it as ROCAR.
- Allocation and sector breakdowns, with options shown inline on the holdings they cover.
Three trackers, or two honest numbers.
The dividend apps can’t see your options. The wheel trackers can’t see your portfolio. Your broker reports premium collected and stays quiet about the gains you capped and the capital you tied up.
OMM holds all three streams. Dividends and price gains feed one honest total return, options premium feeds ROCAR, and the two sit next to each other on one screen. Read them together and you stop guessing what the book earns.
That’s the view every single-lane tool leaves empty.
The real reason, or nothing at all.
A holding gaps 4% and your broker shows you the 4%. When there’s a real cause, OMM names it and links the dated source. The earnings beat. The analyst downgrade. The Fed decision that dragged the whole sector, and your stock along with it. And when nothing in the day’s market data or headlines explains the move, OMM stays silent rather than dress a guess up as analysis. Every other feed has a story for every tick. Ours speaks only when the evidence does. Solo
OMM vs. the single-lane tools.
| Capability | OMM | Dividend trackers | Wheel trackers | Broker dashboard |
|---|---|---|---|---|
| Options income tracking | Full lifecycle + ROCAR | No | Yes | Premium-only |
| Dividend tracking + safety ratings | Yes | Yes | No | No |
| Total return (dividends + price gains) with ROCAR beside it | TWR + XIRR | Price + div only | No | Price-only |
| One unified income view | Yes | No | No | No |
| Roll Scout + position triage | Yes | No | Manual | No |
| “Why’s it moving?” (a cited cause, or it stays silent) | Yes | No | No | No |
See what your portfolio actually earns.
Start free, no card. Solo is $12/mo billed annually when you want the analysis.
Start free, no card neededNo ads. No data selling. Cancel anytime.